Forecasting Content Velocity: How to Model Traffic, Leads, and ROI from Increased Output
You’ve heard the advice a thousand times: "You need to publish more content." It's the default answer for anyone trying to grow their organic traffic. But a nagging question always follows: What will "more" actually get me?
If you double your output from 4 to 8 articles a month, will your traffic double? Will your leads? If you push it to 20, will you 5x your results?
The honest answer is almost always no. Simply increasing your content output without a strategic forecast is like driving faster in the fog. You're moving, but you have no idea where you're headed or what obstacles are in front of you.
This is where most conversations about "content velocity" stop. They teach you how to measure what you've done, but not how to predict what you can achieve. We're going to fix that. This guide will teach you how to move beyond simple measurement and into strategic forecasting, helping you model the real-world impact of your content efforts on traffic, leads, and ultimately, your bottom line.

The Metrics That Matter: What Is Content Velocity, Really?
Before we can forecast, we need a clear, shared language. Content velocity isn't just about speed; it's a measure of your content production's momentum. Think of it as having three core components:
- Volume: The number of content pieces you publish (e.g., articles, videos, podcasts).
- Frequency: The cadence at which you publish (e.g., daily, weekly, monthly).
- Efficiency: The resources (time, money, people) required to produce that content.
Most guides will show you how to use tools like Ahrefs or SEMrush to count your competitor's new URLs over a period to measure their velocity. That's a great starting point for benchmarking, but it's purely descriptive.
To build a predictive model, you need to look inward first. Your forecast will be built on a foundation of your own historical data:
- Average monthly content output: How many articles have you published per month for the last 6-12 months?
- Average traffic per new article: On average, how much monthly traffic does a new article generate after 90 days?
- Average traffic-to-lead conversion rate: What percentage of your blog readers convert into a lead (e.g., sign up for a newsletter, download an ebook)?
This data is your baseline reality. Without it, any forecast is just a guess.
Beyond 'More Is Better': Introducing the Content Forecasting Model
Here's the most common mistake in content planning: assuming a linear relationship between output and results. The thinking goes, "If 5 articles per month get me 100 leads, then 10 articles will get me 200."
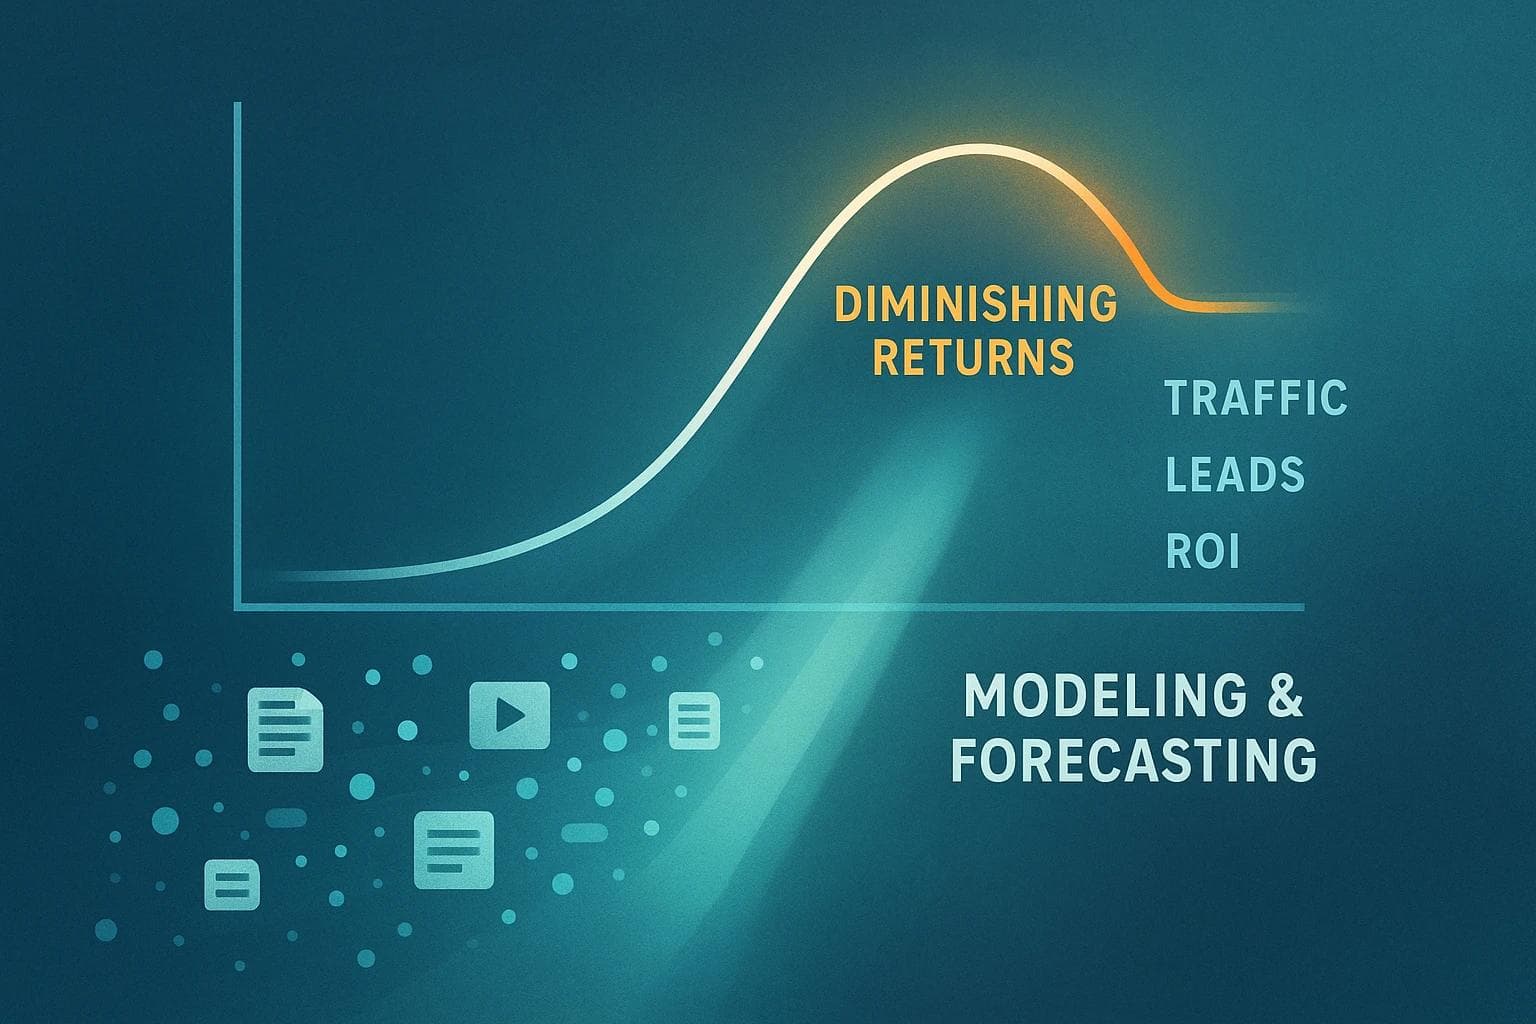
For a little while, that might even be true. But eventually, you'll run into the wall of diminishing returns.
This is the critical concept that most discussions on content velocity ignore. Diminishing returns is the point where each new piece of content you publish generates progressively less impact than the one before it. More effort no longer yields proportional results.

Why does this happen?
- Keyword Saturation: You've already covered the highest-impact topics in your niche. New articles target lower-volume, less relevant keywords.
- Audience Overlap: You're creating content faster than your audience can consume it, leading to lower engagement per piece.
- Internal Competition: Your own articles start competing with each other for the same search terms (cannibalization).
A smart forecast doesn't ignore this reality—it models it.
Step 1: Building Your Basic Traffic and Lead Model
Let's build a simple model in a spreadsheet. This doesn't need to be complicated.
- Column A (Month): List the next 12 months.
- Column B (Content Cadence): Enter your proposed number of articles per month (e.g., 10).
- Column C (Total Articles): Keep a running total of all articles published.
- Column D (Projected Traffic): This is your core calculation. A simple formula could be:
Total Articles * Average Traffic per Article. Use your historical data for the "average traffic" figure. - Column E (Projected Leads): Calculate this with:
Projected Traffic * Traffic-to-Lead Conversion Rate.
Running this simple model already puts you ahead of 90% of content teams. You now have a baseline projection for what a consistent publishing cadence can produce.
Step 2: Modeling Diminishing Returns
Now, let's make our model smarter. Instead of assuming every article performs like the average, we'll apply a "decay factor."
A simple way to do this is to adjust the "Average Traffic per Article" value as your total content volume grows.
- Articles 1-50: Use your historical average (e.g., 300 visitors/month).
- Articles 51-100: Apply a 20% decay factor. Each new article is now projected to bring in 240 visitors/month.
- Articles 101+: Apply a 40% decay factor. Each new article brings in only 180 visitors/month.
These numbers are just examples. The key is acknowledging that growth will slow. By modeling this decay, your forecast becomes far more realistic and helps you identify the potential "tipping point" where massive increases in volume may no longer be the most efficient growth strategy.
From Leads to Dollars: Forecasting ROI and the Quality Factor
Traffic and leads are great, but businesses run on revenue. The final layers of our model connect content directly to financial outcomes and introduce the most important variable of all: quality.
Step 3: Layering in ROI
This is a straightforward extension of our model. Add two more columns:
- Column F (Projected Customers):
Projected Leads * Lead-to-Customer Conversion Rate. You'll get this from your sales or CRM data. - Column G (Projected Revenue):
Projected Customers * Average Customer Lifetime Value (LTV).
Now you can clearly articulate the potential financial impact of publishing 5, 10, or 20 articles per month. You can compare this projected revenue against the cost of content production to forecast your ROI.
Step 4: The Quality Threshold - Your Forecast's Reality Check
Here's the final, crucial "aha moment." A forecast is only valid if the content you produce meets a minimum quality threshold.
Velocity without quality is just creating noise, and it will generate zero results. Your model needs a "quality gate." If a piece of content doesn't meet the threshold, its contribution to the forecast should be zero.
Quality can feel subjective, but we can use quantitative proxies to define it for our model:
- Comprehensiveness: Does the article's word count align with the average of the top 5 ranking pages for the target keyword?
- E-E-A-T (Experience, Expertise, Authoritativeness, Trust): Does it include author bios, cite credible sources, and demonstrate real-world experience?
- User Experience: Is it well-structured with clear headings, images, and internal links?
Before a piece of content's potential traffic is added to your forecast, it must pass this quality check. This prevents the model from rewarding you for publishing 30 low-effort, 500-word articles that will never rank or convert.

Putting Your Forecast to Work: Making Smarter Decisions
This forecasting model isn't just an academic exercise. It's a powerful strategic tool for making real-world decisions.
- Evaluating Platform Claims: When a marketing agency or platform promises to "triple your traffic," you can now plug their proposed content cadence into your model. Does their claim align with your data-driven forecast, even after accounting for diminishing returns? This empowers you to scrutinize promises and choose partners based on realistic outcomes.
- Allocating Resources: Your model can help you answer critical budget questions. Is it better to invest in producing 15 articles a month at your current quality level, or should you reduce the cadence to 8 articles and invest the difference in higher quality (better research, graphics, promotion) to increase the average traffic per article?
- Scaling Quality Content: The biggest challenge is often maintaining quality as you increase velocity. It's a bottleneck that can break any content strategy. Modern tools, like the AI-driven platform from Fonzy AI, are designed to help automate the creation of high-quality, SEO-optimized content, addressing this very challenge of scaling without sacrificing the quality threshold.
By using a forecast, you shift the conversation from "we need to do more" to "we need to do what's most effective."
Frequently Asked Questions (FAQ) about Content Velocity
What is a good content velocity?
There's no magic number. A "good" velocity is the maximum cadence at which you can consistently produce content that meets your quality threshold and contributes to your business goals. For some, that's 4 articles a month; for others, it's 40. Your forecast will help you find your sweet spot.
How do I measure a competitor's content velocity?
Use an SEO tool like Ahrefs or SEMrush. Enter their domain and look for a report on "new pages" or "top pages" by date. This will allow you to see how many new blog URLs they've published over the last 3, 6, or 12 months, giving you a solid benchmark.
Can I increase velocity by just refreshing old content?
Absolutely. Refreshing and republishing existing content is one of the most efficient ways to boost your content's performance. The forecasting for this is slightly different; instead of modeling traffic from a new piece, you model the "lift" or percentage increase in traffic to an existing piece post-update.
When do diminishing returns typically kick in?
It varies by industry and niche maturity. Generally, it begins when you've thoroughly covered your core "money" keywords and start expanding into topics that are more top-of-funnel, lower in search volume, or less directly tied to your product. Your model will help you spot the plateau in your own data.
Your Next Step: From Forecasting to Action
Forecasting your content velocity isn't about getting a perfect prediction. It's about trading ambiguity for clarity. It transforms your content strategy from a hopeful shot in the dark into a data-informed plan for growth.
Start simple. Gather your historical data on content output, traffic, and leads. Build the basic model in a spreadsheet. As you get more comfortable, begin to layer in the more advanced concepts of diminishing returns and quality thresholds.
By doing so, you'll not only be able to set more realistic goals but also make smarter, more profitable decisions about where to invest your most valuable resources: your time, your budget, and your creative energy.

Roald
Founder Fonzy — Obsessed with scaling organic traffic. Writing about the intersection of SEO, AI, and product growth.
Stop writing content.
Start growing traffic.
You just read about the strategy. Now let Fonzy execute it for you. Get 30 SEO-optimized articles published to your site in the next 10 minutes.
No credit card required for demo. Cancel anytime.

Content Templates and Modular Writing for Better Volume and Depth
Learn how modular writing and templates help produce more content without losing quality or originality.

Keeping Brand Voice Accuracy and Compliance When Scaling Content
Learn how to maintain brand voice accuracy and compliance while producing high volumes of content effectively.

Automating Content Ops Which Tasks to Automate First
Discover which repetitive content tasks to automate first to save time and boost your content strategy effectively.